Data Table
Table 2. Citizen reports of coyotes in Edmonton, Alberta. Each row represents an individual sampling unit with various fields representing the observed predictor variables. The variables for season, habitat and neighbourhood were added post-hoc to each report, while all other variables were provided by the reporter through the Edmonton Urban Coyote Project website.

Variable types
|
Table 3. The variables and variable types used to answer each of the three questions posed in this investigation.

|
Where are reports occurring?
Coyote reports of sightings and encounters are widely spatially distributed across the City of Edmonton (Figure 6). The raw data suggests an uneven distribution of coyote sightings based on habitat types.

Figure 6. Location of coyote encounters and sightings in Edmonton. Reports were plotted based on the GPS coordinates of the point identified by the reporter, and overlayed on habitat type classifications extracted from the City of Edmonton uPLVI (Urban Primary Land and Vegetation Inventory) land cover data (City of Edmonton, 2018).
When are Reports occurring?
In our preliminary exploration of the data, we visualized how reports occur on a long term (8 year) and diel scale.
A histogram was used to investigate how reports had varied on a monthly basis from 2012 to 2020 and revealed that reporting frequency was very inconsistent both between years and within years (Figure 7). A caveat of this data is that an increase or decrease in the frequency of reports does not indicate any change in human-coyote coexistence, as the reporting website has varied in popularity over time due to inconsistent advertising. To address question 3 and determine if human-coyote coexistence has changed between 2012 and 2020 the number of encounters must be examined with the number of sightings as a baseline measurement.
We could not investigate the diurnal patterns on an hourly basis because the reporting website drop-down menu did not include hourly times between midnight and 5am. We acknowledge that the reporting website inadvertently biased this data, and although human inactivity is presumably low at this time and few reports were likely missed any diel patterns in the data should be interpreted with caution. In an attempt to avoid misinterpretation, we blocked the hourly times into six hour blocks to investigate the number of reports occurring at night (0:00-6:00 and 18:00-24:00), morning (6:00-12:00) and afternoon (12:00-18:00) (figure 8). It is important to note that these time periods do not precisely represent daytime and nighttime hours due to variation in sunlight hours from Edmonton's northern latitude.

Figure 7. Histogram of the frequency of coyote sightings and encounters from 2012 to 2020. The histogram is binned by month (N=96 bins).
|
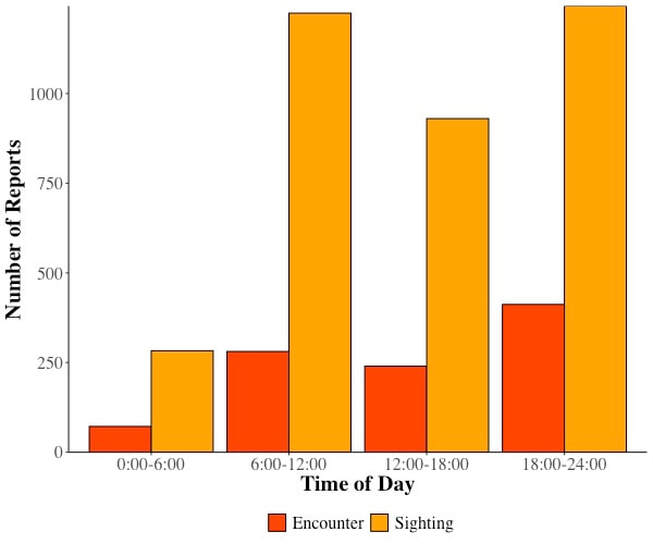
Figure 8. The number of coyote sightings and encounters at night (0:00-6:00 and 18:00-24:00), morning (6:00-12:00) and afternoon (12:00-18:00).
|
